Forecasters at the Climate Prediction Center haven’t declared El Niño conditions, even though the Nino3.4 index is currently around 0.5°C above normal, and has been for the past two months. What’s the hold up? In short, we’re waiting for the atmosphere to respond to the warmer sea-surface temperatures, and give us the “SO” part of ENSO.
SO what? The Southern Oscillation, that’s what. The Southern Oscillation is a seesaw in surface pressure between a large area surrounding Indonesia and another in the central-to-eastern tropical Pacific; it’s the atmospheric half of El Niño. Since ENSO is a coupled system, meaning the atmosphere and ocean influence each other, both need to meet the criteria for El Niño before we declare El Niño conditions.
During average (non-El Niño) times, the waters of the western tropical Pacific are much warmer than in the east/central area (Figure 1). As warmer water extends out to the east during an El Niño, it warms the air, causing it to rise (lower pressure) (Figure 2). In turn, there is less rising motion (higher pressure) near Indonesia, due to the relatively cooler waters and overlying air.
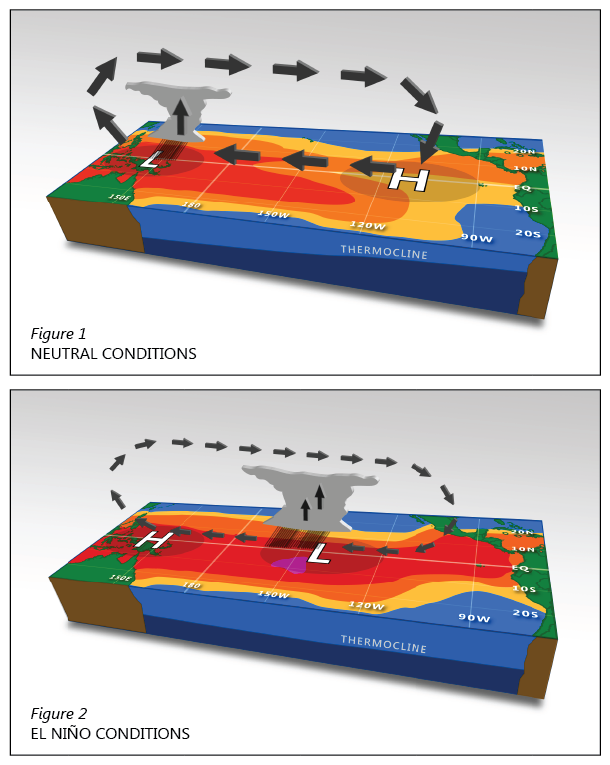 Figure 1. Average state of ocean temperatures, rainfall, pressure, and winds over the Pacific during ENSO-neutral conditions. Figure 2. Generalized state of the ocean and atmosphere during El Niño conditions. NOAA image created by David Stroud.
The pressure changes influence the wind patterns. The average (non-El Niño) state of the atmosphere over the tropical Pacific features convection and rainfall over Indonesia, low-level easterly winds (the trade winds that blow from east to west), and upper-level westerly winds (Figure 1). These are the basic components of the Pacific Walker Circulation.
During El Niño, the system shifts: we see weaker trade winds over the Pacific, less rain than usual over Indonesia, and more rain than usual over the central or eastern Pacific. During some El Niño events, the trade winds along the equator even reverse, and we see low-level westerlies… but not every time. In fact, every El Niño is different, and both the ocean and atmospheric characteristics vary quite a lot from event to event–but that’s a topic for another post!
This difference from average air pressure patterns across the Pacific is measured a few different ways. One is the Southern Oscillation Index (SOI), which is based on a long record of pressure measured by two stations: one in Darwin, Australia (south of Indonesia) and the other in Tahiti (east-central tropical Pacific) (Figure 3). A negative SOI indicates Darwin’s pressure is higher than average and Tahiti’s is lower than average: El Niño conditions. (I keep saying “higher than average” because we’re not just comparing Darwin’s pressure to Tahiti’s, but rather comparing the anomalies at each. Imagine comparing the price of a gallon of water to that of a gallon of gas. A negative index is if the price of the water goes up, and the gas goes on sale. The gas may still cost more than the water, but it’s the relative changes in the two prices that matter.)
A second way we describe the air pressure anomalies over the tropical Pacific is the Equatorial Southern Oscillation Index (EQSOI). The EQSOI is based on pressure differences between two regions located on the equator (Figure 3). The SOI is monitored because it has a very long record available, stretching back to the 19th century; the EQSOI depends on satellite observations, which means it is a shorter record, but it gives a better picture of what’s happening right along the equator.
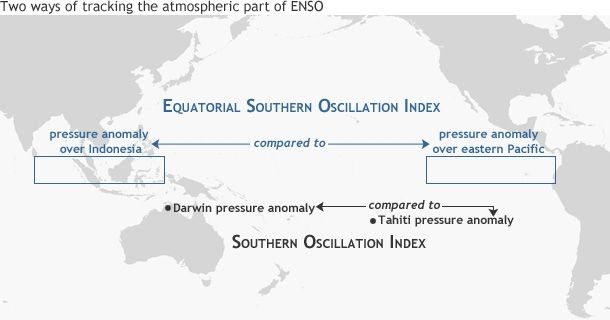 Figure 3. Two ways of measuring the Southern Oscillation: the SOI and the EQSOI. Both depend on comparing the strength of pressure anomalies in different parts of the Pacific basin. Map by NOAA Climate.gov.
As of the end of June, both the SOI and the EQSOI are at +0.2 (they have trended downward over the past few months), and the wind patterns are roughly average over the tropical Pacific, with some slight weakening of the trade winds toward the end of the month. There is increased convection in the central Pacific, but also some over Indonesia… all of which says we’re still waiting for the atmosphere to get dressed in its El Niño clothes and come out to play.
However, we think it’s likely that the atmosphere will get on board soon, and we’re still predicting El Niño, with about a 70% chance that conditions will be met in the next few months, and around an 80% chance by this fall. If you’re interested in how the ocean and atmospheric conditions are evolving, CPC has weekly updates available.
By Emily Becker from Climate.gov, with thanks to David Stroud for his help with this post.
To read more of Emily’s work visit here: http://www.climate.gov/author/emily-becker
– NOAA